Linear regression is a statistical and machine learning algorithm used to establish a relationship between a dependent variable and one or more independent variables. It is a technique that aims to find the best-fit line that can describe the relationship between the variables in the dataset.
In simple linear regression, we have one dependent variable and one independent variable. The algorithm attempts to find the best fit line that minimizes the difference between the actual values and the predicted values of the dependent variable. In multiple linear regression, we have more than one independent variable, and the algorithm attempts to find the best-fit line that can predict the dependent variable using these independent variables.
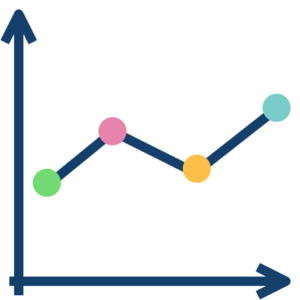
How simple linear regression works:
The linear function in linear regression is typically expressed as a weighted sum of the input variables, where the weights are the regression coefficients that are learned during the training process. The weighted sum is then used to estimate the value of the output variable.
Mathematically, the linear regression model can be represented as:
y = b0 + b1x1 + b2x2 + … + bn*xn
where y is the output variable, x1 to xn are the input variables, b0 is the intercept term, and b1 to bn are the regression coefficients for the input variables.
During the training process, the linear regression model is fitted to the training data using a technique called least squares estimation.
The objective of least squares estimation is to find the values of the regression coefficients that minimize the sum of the squared errors between the predicted values and the actual values of the output variable. This involves computing the mean squared error between the predicted values and the actual values of the output variable, and then finding the values of the regression coefficients that minimize the mean squared error.
Once the linear regression model is trained, it can be used to make predictions on new data by computing the weighted sum of the input variables and adding the intercept term. The resulting value is the estimated value of the output variable.
Linear regression works by modeling the relationship between the input variables and the output variable as a linear function. The model is trained using least squares estimation, and the regression coefficients are learned to minimize the sum of the squared errors between the predicted values and the actual values of the output variable. The model is then used to make predictions by computing the weighted sum of the input variables and adding the intercept term.
Advantages of simple linear regression:
- It is a simple and easy-to-understand algorithm that can be used in many different applications.
- It can be used for both classification and regression problems.
- It can help in identifying the relationship between the variables in the dataset and can be used for predicting future values of the dependent variable.
Disadvantages of simple linear regression:
- It assumes that there is a linear relationship between the independent and dependent variables, which may not always be the case.
- It may not work well with non-linear data.
- It can be sensitive to outliers in the dataset.
An example of building a simple linear regression; model using Python’s scikit-learn library:
We will use the Boston Housing dataset, which is a built-in dataset in scikit-learn and contains information about different properties in Boston. We will use the dataset to predict the median value of owner-occupied homes in Boston.
Here are the steps to create the model:
- Import the necessary libraries and load the dataset.
Note that this is just a simple example, and in real-world scenarios, there may be more preprocessing and feature engineering required to get better results from the model.
Reference reserach paper:
Montgomery, D. C., Peck, E. A., & Vining, G. G. (2021). Introduction to linear regression analysis. John Wiley & Sons.
That’s all for this post!
You can also check my other posts on machine learning here: https://ai-researchstudies.com/home/blog/
Happy Reading!! 